
Publications
Since 2023, members of AlgoForGe have published in the leading venues of both communities that the
research unit brings together: in algorithms and theory (e.g., SoCG, ICALP, ESA, STOC, SEA, ALENEX),
in geodesy and geoscience (e.g., ESSD, The Cryosphere), and at the interface of the two (e.g., ACM TSAS,
IEEE TVCG, ACM SIGSPATIAL, PFG, ISPRS Annals, Information Fusion). Our results also reach the wider AI
and data-science community, with papers at NeurIPS, VLDB, KDD and SDM. Below we present selected
highlights, followed by the full list of publications.
Overview: our survey
For an accessible introduction to the research line of AlgoForGe, see our survey for the
geoinformation community. It reviews recent developments in algorithm engineering and computational
geometry and highlights the feedback loop between problem modelling and algorithm engineering.
- J.-H. Haunert, A. Driemel, P. Mutzel. Geoinformation perspectives on recent developments in algorithm engineering and computational geometry. PFG – Journal of Photogrammetry, Remote Sensing and Geoinformation Science, 2026. doi
Highlights
Most of the highlights below are joint results of several projects of the research unit; the project
codes under each highlight show which projects contributed.
Polygon aggregation: from buildings to settlements, across scales and over time
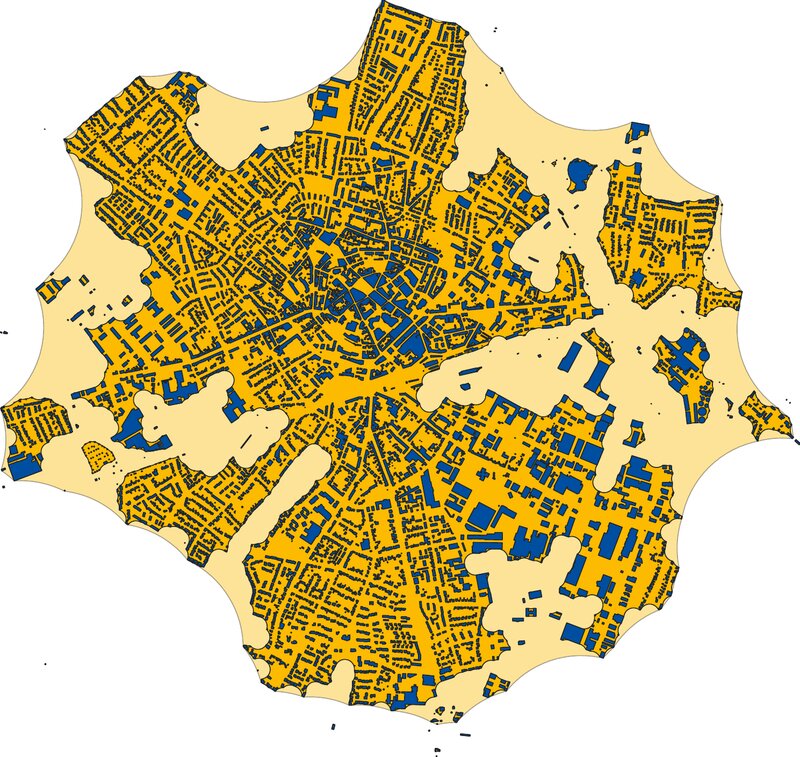 When a map is zoomed out, individual buildings have to be merged into blocks, settlement areas and
eventually cities. Instead of rule-based pipelines, we state this as a bicriteria optimization problem
that trades off the total area against the total perimeter of the result. With a weighted sum, the
problem reduces to a minimum cut, and the whole hierarchy of nested aggregations for all weights follows
from a single parametric minimum-cut computation, for which we developed a simpler and practically
efficient algorithm that finds the breakpoints in order (ALENEX 2025). At ESA 2026 we showed that the
restriction to a fixed subdivision of the plane can be dropped altogether: an optimal aggregation with
arbitrary shapes can be computed via an arrangement of circular arcs and line segments. Further variants
preserve the characteristic edge orientations of buildings, and the entire Pareto set can be computed
output-sensitively. At ACM SIGSPATIAL 2026, we extend the approach to multi-temporal building data: we
propose temporal subdivision schemes that keep aggregations consistent over time and across scales,
evaluate them on OpenStreetMap and GHS-OBAT data, and provide an interactive tool to explore urban
development over time.
Figure (right): Aggregation of all buildings of the town of Euskirchen with arbitrary shapes; the two shades of orange show two nested optimal solutions for different weights of area and perimeter.
When a map is zoomed out, individual buildings have to be merged into blocks, settlement areas and
eventually cities. Instead of rule-based pipelines, we state this as a bicriteria optimization problem
that trades off the total area against the total perimeter of the result. With a weighted sum, the
problem reduces to a minimum cut, and the whole hierarchy of nested aggregations for all weights follows
from a single parametric minimum-cut computation, for which we developed a simpler and practically
efficient algorithm that finds the breakpoints in order (ALENEX 2025). At ESA 2026 we showed that the
restriction to a fixed subdivision of the plane can be dropped altogether: an optimal aggregation with
arbitrary shapes can be computed via an arrangement of circular arcs and line segments. Further variants
preserve the characteristic edge orientations of buildings, and the entire Pareto set can be computed
output-sensitively. At ACM SIGSPATIAL 2026, we extend the approach to multi-temporal building data: we
propose temporal subdivision schemes that keep aggregations consistent over time and across scales,
evaluate them on OpenStreetMap and GHS-OBAT data, and provide an interactive tool to explore urban
development over time.
Figure (right): Aggregation of all buildings of the town of Euskirchen with arbitrary shapes; the two shades of orange show two nested optimal solutions for different weights of area and perimeter.
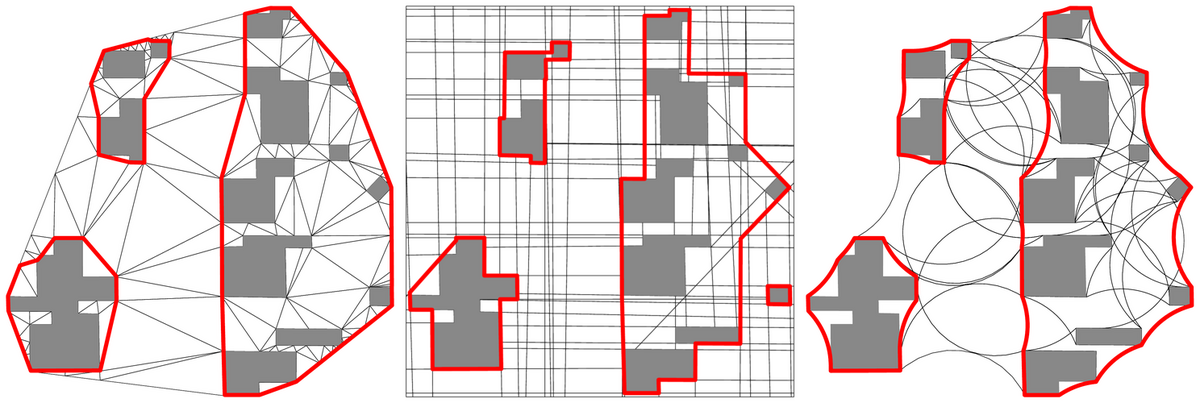
Figure: Aggregation of buildings (grey) into output regions (red outline) based on a conforming Delaunay
triangulation (left), on a subdivision from extended polygon edges (middle), and with arbitrary shapes (right).
Projects: A1, B1, B2, C1
- P. Rottmann, A. Driemel, H. J. Haverkort, H. Röglin, J.-H. Haunert. Bicriteria shapes: Hierarchical grouping and aggregation of polygons with an efficient graph-cut approach. ACM TSAS 11(1), 2025. doi
- A. Beines, M. Kaibel, P. Mayer, P. Mutzel, J. Sauer. A simpler approach for monotone parametric minimum cut: Finding the breakpoints in order. ALENEX 2025. doi
- L. Blank, D. Eppstein, J.-H. Haunert, H. J. Haverkort, B. Kolbe, P. Mayer, P. Mutzel, A. Naumann, J. Sauer. Bicriteria polygon aggregation with arbitrary shapes. ESA 2026. doi
- P. Mayer, A. Naumann, F. Roth, A. Bonerath, J. Sauer, P. Mutzel, J.-H. Haunert. Temporally consistent aggregation of building footprints [Experiment]. ACM SIGSPATIAL 2026, to appear.
- A. Naumann, S. Bergé, J. Sauer, J.-H. Haunert. Building footprint aggregation with preservation of edge orientations. ISPRS Annals XI-4-2026. doi
- J. Könen, H. Röglin, T. Stuck. Parameterized algorithms for computing Pareto sets. ESA 2025. doi
- Benchmark instances: J.-H. Haunert, P. Mayer, P. Mutzel, A. Naumann, P. Rottmann, J. Sauer. Polygon aggregation max-flow instances for the 13th DIMACS Implementation Challenge. Zenodo, 2026. doi
Clustering time series and trajectories with the Fréchet distance
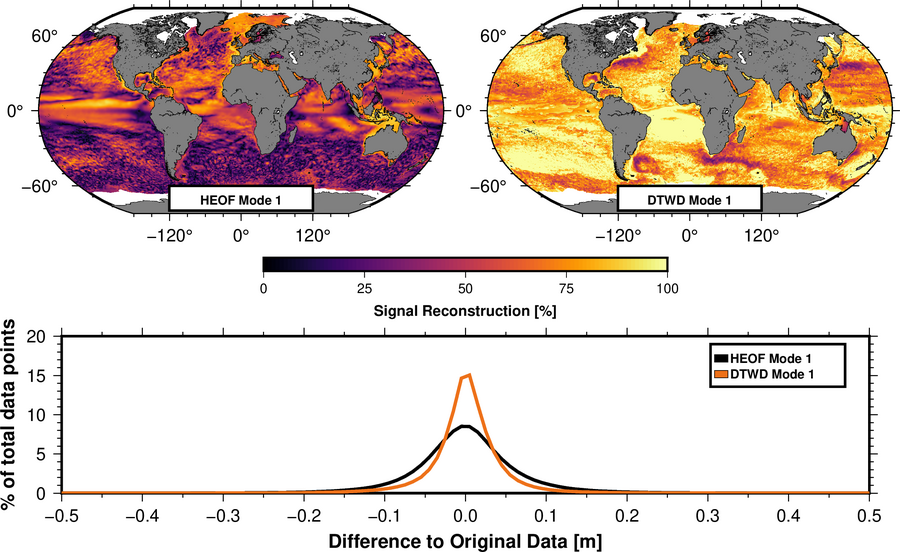 Sea-level records are time series of different lengths and with shifted features. We gave the first
(1+ε)-approximation schemes for (k,ℓ)-clustering of curves under the discrete Fréchet distance with
running time polynomial in k, based on the first coreset for distance evaluation whose size does not
depend on the length of the curve. We also introduced a time-series decomposition based on the Fréchet
distance. In geodesy, this led to a DTW-based alternative to the classical PCA/EOF analysis of
sea-level fields: modes may shift in phase across the ocean, and the method is markedly less sensitive
to outliers.
Figure: Share of the sea-level signal explained by the first mode, Hilbert EOF vs. DTW-based decomposition.
Sea-level records are time series of different lengths and with shifted features. We gave the first
(1+ε)-approximation schemes for (k,ℓ)-clustering of curves under the discrete Fréchet distance with
running time polynomial in k, based on the first coreset for distance evaluation whose size does not
depend on the length of the curve. We also introduced a time-series decomposition based on the Fréchet
distance. In geodesy, this led to a DTW-based alternative to the classical PCA/EOF analysis of
sea-level fields: modes may shift in phase across the ocean, and the method is markedly less sensitive
to outliers.
Figure: Share of the sea-level signal explained by the first mode, Hilbert EOF vs. DTW-based decomposition.
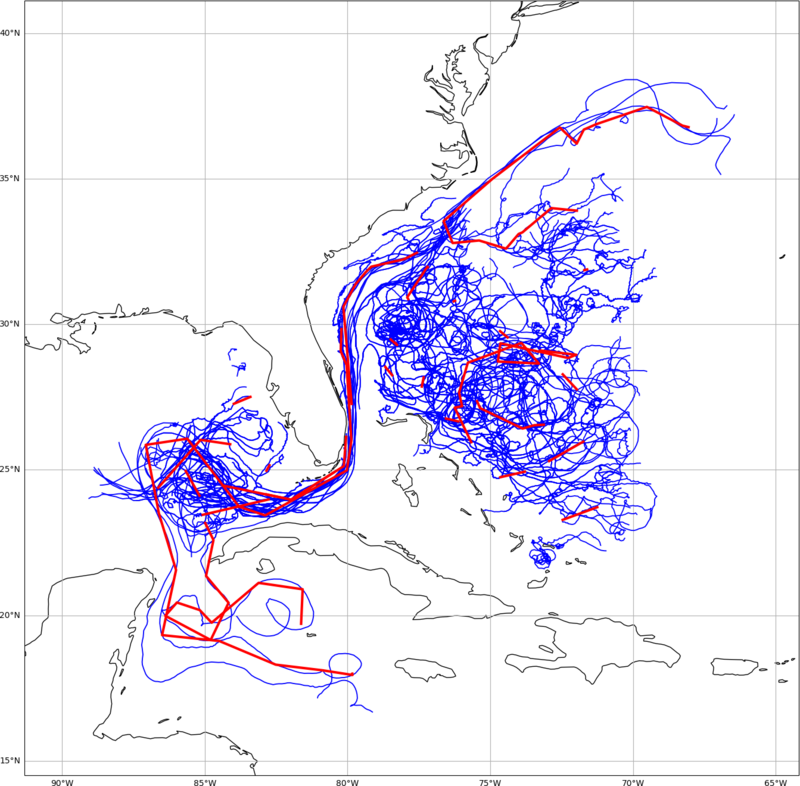 Thousands of drifting buoys of NOAA's Global Drifter Program record ocean surface currents. Using
subtrajectory clustering under the Fréchet distance, formulated as a geometric set-cover problem, we
find regions where water masses move coherently and carry many drifters along together. The similarity
measure is robust to small-scale variability caused by ocean eddies. Clusters of drifters carried by the
Gulf Stream along the North American coast appear consistently in every year from 2021 to 2024.
Figure: Drifter trajectories (blue) and trajectories of cluster centers (red) in the North Atlantic, 2024.
Thousands of drifting buoys of NOAA's Global Drifter Program record ocean surface currents. Using
subtrajectory clustering under the Fréchet distance, formulated as a geometric set-cover problem, we
find regions where water masses move coherently and carry many drifters along together. The similarity
measure is robust to small-scale variability caused by ocean eddies. Clusters of drifters carried by the
Gulf Stream along the North American coast appear consistently in every year from 2021 to 2024.
Figure: Drifter trajectories (blue) and trajectories of cluster centers (red) in the North Atlantic, 2024.
Projects: A3, B1, C2
- A. Driemel, J. Höckendorff, I. Psarros, C. Sohler, D. Yue. Near linear time approximation schemes for clustering of partially doubling metrics. ICALP 2026. doi
- A. Driemel, J. Höckendorff, I. Psarros, C. Sohler. Time series decomposition using the Fréchet distance. ESA 2026. doi
- B. Uebbing, J. Höckendorff, C. Jungheim, A. Driemel, C. Sohler, J. Kusche. An alternative to PCA utilizing dynamic time warping. EGU General Assembly 2024. doi
- J. Conradi, A. Driemel. Finding complex patterns in trajectory data via geometric set cover. arXiv:2308.14865, 2023. arXiv
- J. Conradi, A. Driemel. Subtrajectory clustering and coverage maximization in cubic time, or better. ESA 2025. doi
Connected clustering: from tide gauges to ocean regions
The global network of tide gauges is dense along some coastlines and sparse elsewhere, which biases
reconstructions of global mean sea level. This question from geodesy led us to the theory of
connected clustering: every cluster must form a connected part of a given proximity graph, such
as the coastline. We obtained the first approximation algorithms and matching lower bounds for connected
k-center and k-diameter, results for connected k-median, and exact algorithms for trees and paths, the
structure that coastlines induce. On real data, a clustered selection of about 350 stations reconstructs
global mean sea level more accurately than using all stations.
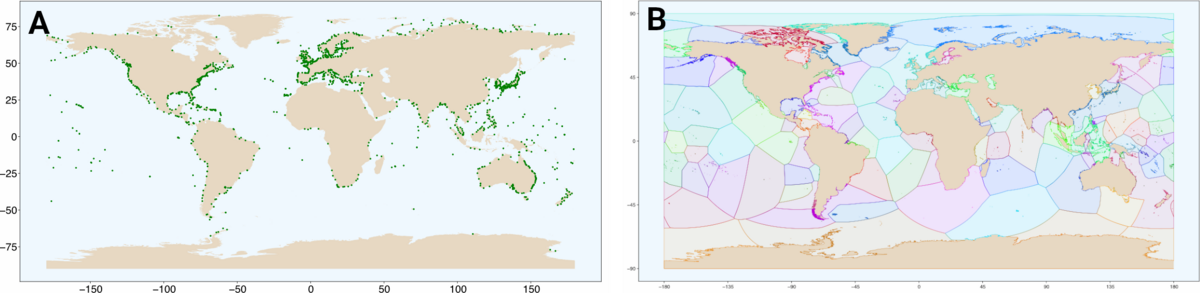
Figure: (A) The global tide-gauge network. (B) An equitable, Voronoi-based connected clustering along the coastline graph (figure: J. Hillebrand).
The same idea carries over to the satellite-altimetry grid. Connected subspace clustering
partitions it into spatially connected ocean regions whose sea-surface-height time series are well
described by a low-dimensional model. We prove that this problem is NP-hard to approximate within a
factor better than Ω(√n) and give a scalable heuristic that enforces connectivity. Applied to more than
30 years of altimetry, the recovered regions carry clear geophysical meaning: the signal of individual
clusters tracks the El Niño–Southern Oscillation (ENSO).
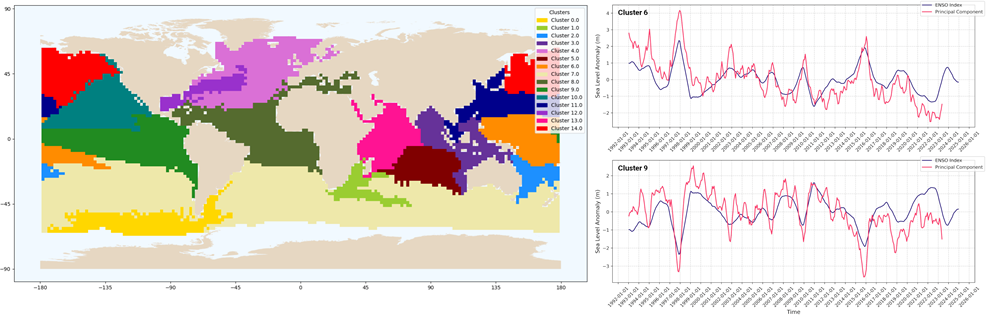
Figure: Connected clustering of the satellite-altimetry grid (15 clusters). Left: the recovered ocean regions. Right: the sea-surface-height signal of two clusters (red) follows the ENSO index (blue).
Projects: A1, A2, A3, C2
- L. Drexler, J. Eube, K. Luo, D. Reineccius, H. Röglin, M. Schmidt, J. Wargalla. Connected k-center and k-diameter clustering. Algorithmica 86(11), 2024 (preliminary version at ICALP 2023). doi
- J. Eube, K. Luo, D. Reineccius, H. Röglin, M. Schmidt. Connected k-median with disjoint and non-disjoint clusters. ESA 2025. doi
- J. Eube, H. Röglin. New algorithms and hardness results for connected clustering. ESA 2026. doi
- J. Hillebrand, J. Höckendorff, J. Kusche, K. Luo, H. Röglin, M. Schmidt, C. Sohler, B. Uebbing. Connected subspace clustering: Hardness, a scalable heuristic, and an application to sea level geodesy. arXiv:2608.14215, 2026. arXiv
Regionalization: grouping districts into regions
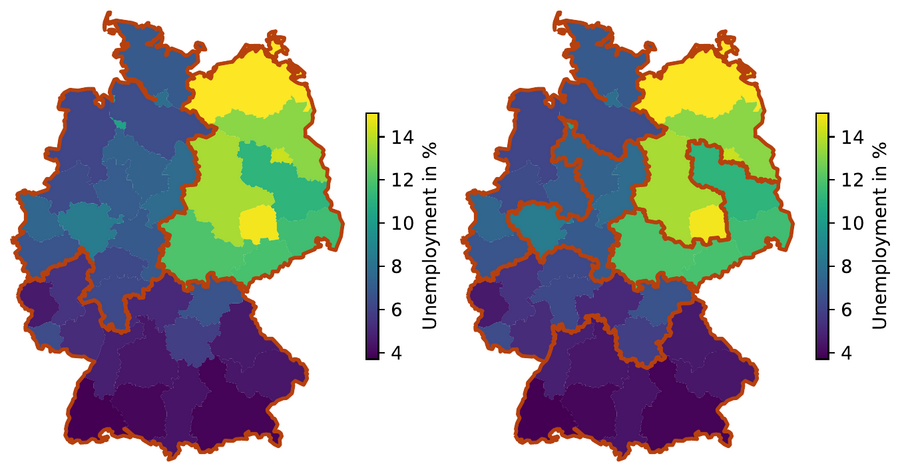 Regionalization aggregates the areas of a planar subdivision, such as a country's districts, into larger
regions that are geographically coherent and homogeneous with respect to an attribute. We approach this
task from two complementary directions. As an exact approach, we consider the p-regions problem,
a connected clustering problem: the districts are partitioned into p connected regions that are as
homogeneous as possible. Existing methods are either heuristic or do not scale. We introduced new integer
linear programming formulations that are provably stronger than the state of the art; in a
branch-and-cut implementation they solve instances for entire European countries that were previously
out of reach. This work grew out of a master's thesis co-supervised by C1 and B2.
Figure: Optimal p-regions of the German districts for p = 3 (left) and p = 6 (right), homogeneous with respect to the unemployment rate.
Regionalization aggregates the areas of a planar subdivision, such as a country's districts, into larger
regions that are geographically coherent and homogeneous with respect to an attribute. We approach this
task from two complementary directions. As an exact approach, we consider the p-regions problem,
a connected clustering problem: the districts are partitioned into p connected regions that are as
homogeneous as possible. Existing methods are either heuristic or do not scale. We introduced new integer
linear programming formulations that are provably stronger than the state of the art; in a
branch-and-cut implementation they solve instances for entire European countries that were previously
out of reach. This work grew out of a master's thesis co-supervised by C1 and B2.
Figure: Optimal p-regions of the German districts for p = 3 (left) and p = 6 (right), homogeneous with respect to the unemployment rate.
Instead of imposing geographic coherence as a hard constraint, we can also treat geography and the
attribute as two separate objectives. We gave the first systematic study of approximately Pareto-optimal
solutions in which two clustering objectives (k-center, k-median, k-means, min-sum-radii or
k-separation), each over its own metric, are optimized jointly (NeurIPS 2024). The trade-off solutions
recover structure that neither objective captures alone: spatially clean regions that still reflect the
income variation. The same idea later became the backbone for grouping tide-gauge stations.
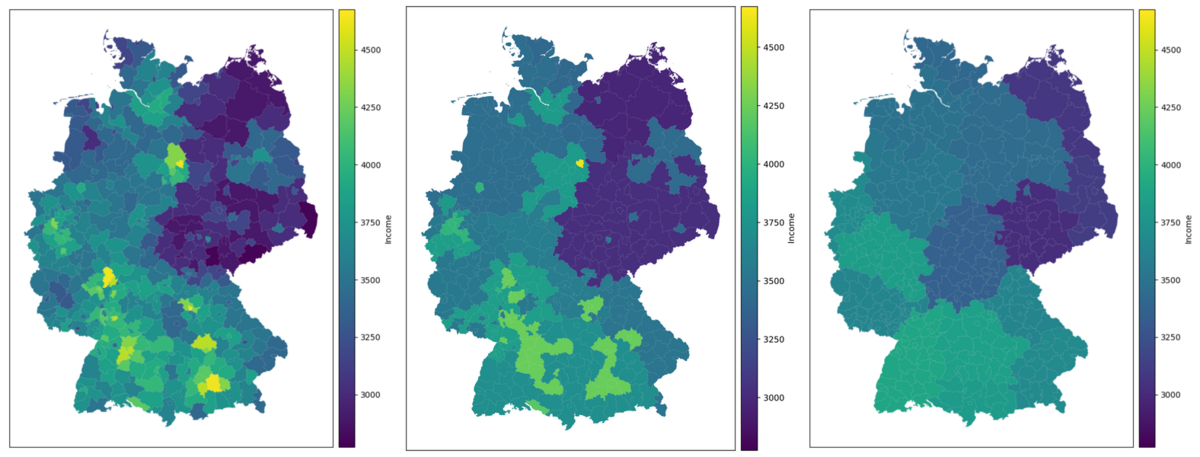
Figure: Clustering of the German districts (k = 16) by income only (left), a Pareto-optimal trade-off (middle), and by geography only (right).
Projects: A1, A2, B2, C1
Graph similarity: from building footprints to temporal graphs
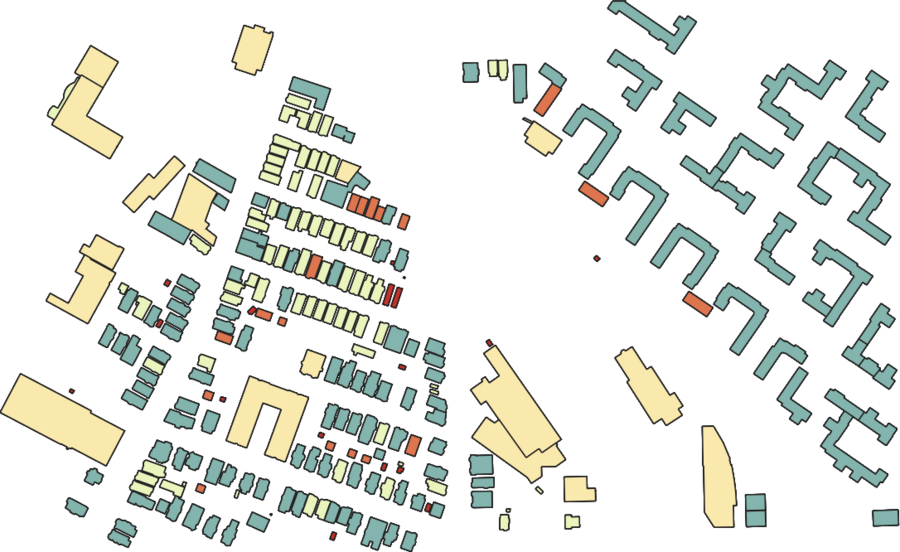 Map generalization treats similar objects in the same way, so it needs a notion of shape similarity. We
represent each building footprint by a skeleton graph derived from its medial axis. A first measure
combines Weisfeiler–Leman label propagation with optimal transport; spectral clustering on it groups
footprints in a way that matches human perception. The new distance geomGMD additionally captures
edge lengths and angles, is provably a metric, yields an interpretable correspondence between parts of
two footprints, and scales to OpenStreetMap data. In addition, new ILP formulations compute the graph
edit distance exactly for graphs far beyond previous reach.
Beyond maps, we study how well graph neural networks can distinguish temporal graphs, in which the
direction of time determines which nodes can influence each other at all. We introduce consistent event
graph isomorphism, generalize the Weisfeiler–Leman test to temporal graphs, and derive a message-passing
scheme with provably matching expressive power (NeurIPS 2026, joint work with the University of Würzburg).
Figure: Clusters of building footprints from Boston, based on a graph-Wasserstein similarity of their skeleton graphs.
Map generalization treats similar objects in the same way, so it needs a notion of shape similarity. We
represent each building footprint by a skeleton graph derived from its medial axis. A first measure
combines Weisfeiler–Leman label propagation with optimal transport; spectral clustering on it groups
footprints in a way that matches human perception. The new distance geomGMD additionally captures
edge lengths and angles, is provably a metric, yields an interpretable correspondence between parts of
two footprints, and scales to OpenStreetMap data. In addition, new ILP formulations compute the graph
edit distance exactly for graphs far beyond previous reach.
Beyond maps, we study how well graph neural networks can distinguish temporal graphs, in which the
direction of time determines which nodes can influence each other at all. We introduce consistent event
graph isomorphism, generalize the Weisfeiler–Leman test to temporal graphs, and derive a message-passing
scheme with provably matching expressive power (NeurIPS 2026, joint work with the University of Würzburg).
Figure: Clusters of building footprints from Boston, based on a graph-Wasserstein similarity of their skeleton graphs.
Projects: B2, C1
- S. Duong, P. Rottmann, J.-H. Haunert, P. Mutzel. Clustering building footprint polygons based on graph similarity measures. ACM SIGSPATIAL UrbanAI 2023. doi
- L. Bülte, A. Naumann, J. Schlurmann, J.-H. Haunert, P. Mutzel. geomGMD: Translation- and rotation-invariant geometric graph mapping distance for building footprint similarity. ACM SIGSPATIAL 2026, to appear.
- A. D'Ascenzo, J. Meffert, P. Mutzel, F. Rossi. Enhancing graph edit distance computation: Stronger and orientation-based ILP formulations. Proc. VLDB Endow. 18(11), 2025. doi
- F. Heeg, J. Sauer, P. Mutzel, I. Scholtes. Weisfeiler and Leman follow the arrow of time: Expressive power of message passing in temporal event graphs. NeurIPS 2026, to appear. arXiv
Consistent interactive maps with a time slider
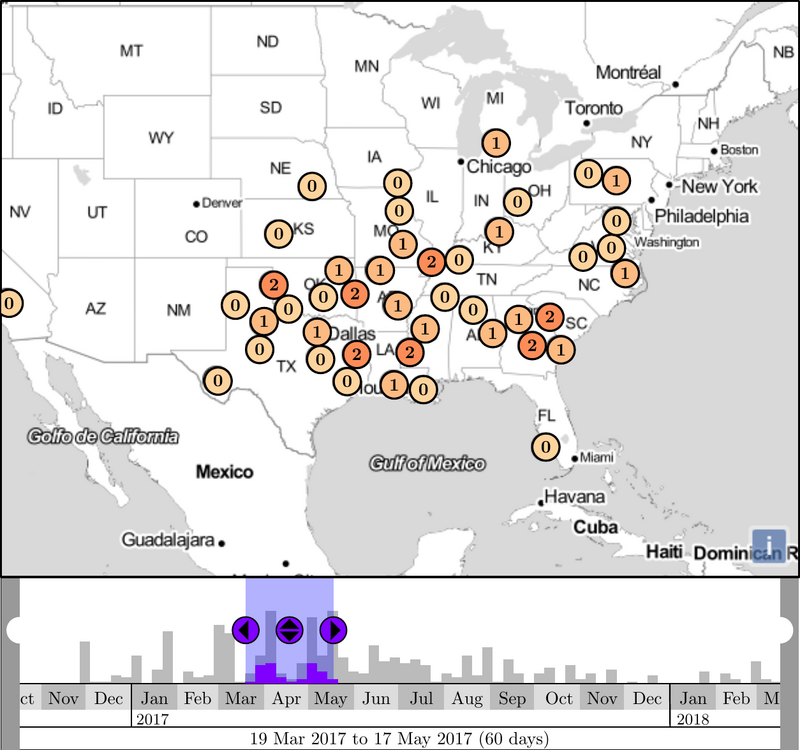 Events such as geotagged posts or incidents are time-stamped points. In an interactive map, users filter
them with a temporal range slider and expect the map to update instantly. We developed data structures
and algorithms that update the labeled map without perceptible delay. They also enforce the consistency
criteria that distinguish interactive maps from static ones: no implausible changes during interaction
and no flickering.
Figure: Interactive map of spatio-temporal events with a time-range slider.
Events such as geotagged posts or incidents are time-stamped points. In an interactive map, users filter
them with a temporal range slider and expect the map to update instantly. We developed data structures
and algorithms that update the labeled map without perceptible delay. They also enforce the consistency
criteria that distinguish interactive maps from static ones: no implausible changes during interaction
and no flickering.
Figure: Interactive map of spatio-temporal events with a time-range slider.
Projects: A1, B1, B2, C1
- A. Bonerath, A. Driemel, J.-H. Haunert, H. Haverkort, E. Langetepe, B. Niedermann. Algorithms for consistent dynamic labeling of maps with a time-slider interface. IEEE TVCG 31(10), 2025. doi
How much are the world's oceans warming?
The oceans absorb most of the additional heat in the climate system. Converting satellite observations of
sea level into ocean heat content usually relies on a single global factor. We instead use the dominant
patterns of steric sea level from an ocean reanalysis, fit them jointly to GRACE satellite gravimetry,
satellite altimetry and Argo profiles, and rescale each pattern separately. The result is a monthly,
gridded record of ocean heat content. For 2005–2024, the estimated global ocean heat uptake of about
0.62 W/m² agrees with other datasets; the Pacific contributed the most, followed by the Indian and Atlantic
Oceans, and the Indian Ocean took up an unusually large amount of heat between 2005 and 2015. In individual
ocean basins, the results differ from model simulations by double-digit percentages. The University of
Bonn published a press release on the study, which has been
picked up by several press offices.
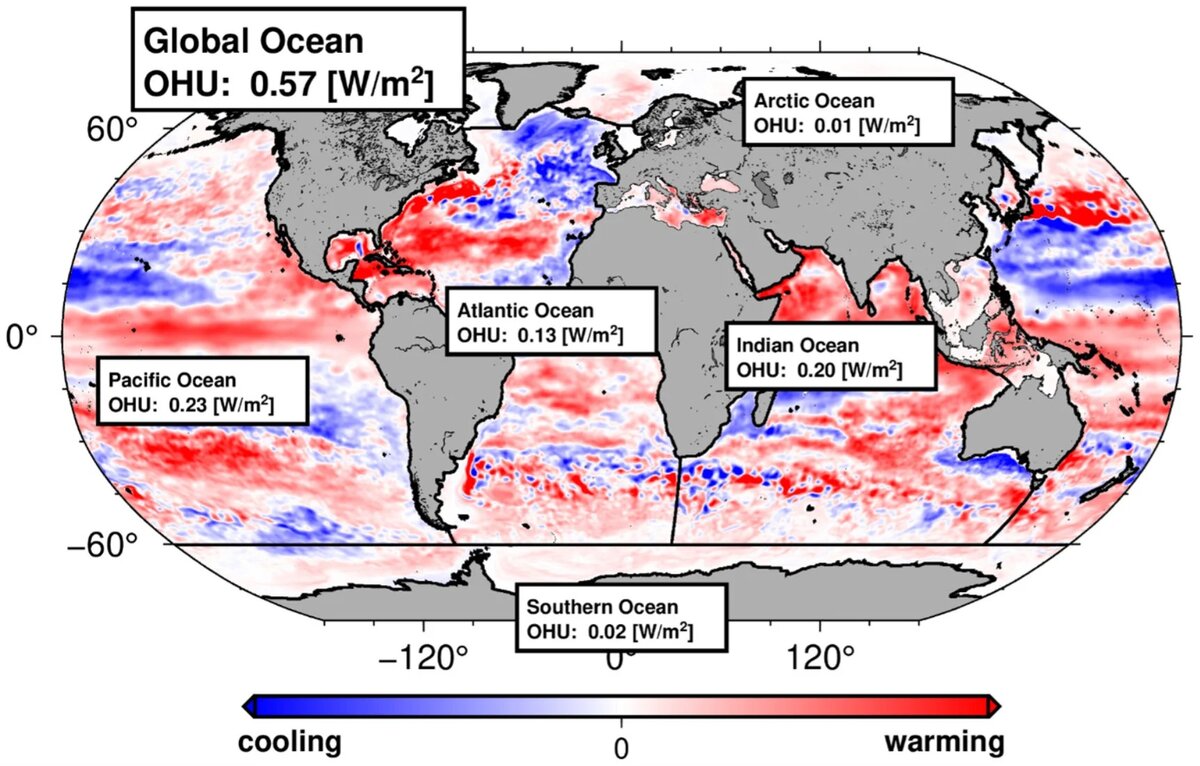
Figure: Heat energy uptake (OHU) in the major ocean basins, as determined from satellite measurements over the past 20 years (figure: Bernd Uebbing/University of Bonn).
Project: C2
- B. Uebbing, K. Vielberg, R. Rietbroek, B. Aschenneller, A. Köhl, J. Kusche. Improving global and regional ocean heat content by consistently combining GRACE gravity, satellite altimetry and Argo profile observations in a joint inversion framework. Earth System Science Data 18(9):6945–6972, 2026. doi
- Dataset: B. Uebbing, J. Kusche. Gridded (0.25 deg) monthly ocean heat content from consistently combining GRACE(-FO) satellite gravimetry, in situ Argo profiles and satellite altimetry. PANGAEA, 2026. doi
- Press release: How much are the world's oceans warming? University of Bonn, 2 October 2026. link
Reconstructing the sea surface from tide gauges with optimal triangulations
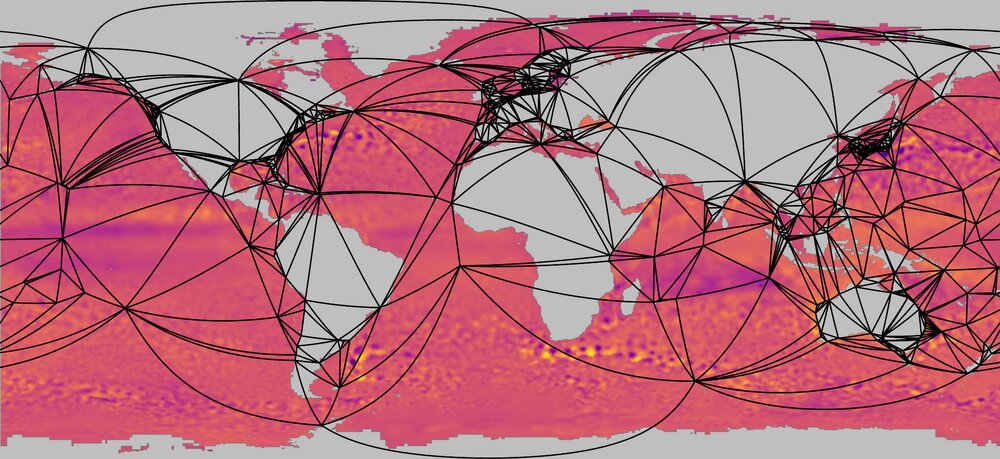 Satellite altimetry covers the oceans only since the 1990s, whereas tide gauges reach back much further
but are sparse. We learn a triangulation of the tide-gauge stations that best interpolates the sea
surface in epochs with satellite reference data and then use it for earlier decades. Finding a
minimum-error triangulation is NP-hard and cannot be approximated within any multiplicative factor.
Restricted to higher-order Delaunay triangulations, however, an exact dynamic program handles global
instances with up to 800 stations. A version on the sphere, needed for global reconstructions, is
implemented and currently being evaluated.
Figure: Global sea-level anomaly in May 2000 with the minimum-error triangulation of the PSMSL tide-gauge stations.
Satellite altimetry covers the oceans only since the 1990s, whereas tide gauges reach back much further
but are sparse. We learn a triangulation of the tide-gauge stations that best interpolates the sea
surface in epochs with satellite reference data and then use it for earlier decades. Finding a
minimum-error triangulation is NP-hard and cannot be approximated within any multiplicative factor.
Restricted to higher-order Delaunay triangulations, however, an exact dynamic program handles global
instances with up to 800 stations. A version on the sphere, needed for global reconstructions, is
implemented and currently being evaluated.
Figure: Global sea-level anomaly in May 2000 with the minimum-error triangulation of the PSMSL tide-gauge stations.
Projects: A1, B1, B2, C1, C2
- A. Arutyunova, A. Driemel, J.-H. Haunert, H. J. Haverkort, J. Kusche, E. Langetepe, P. Mayer, P. Mutzel, H. Röglin. Minimum-error triangulations for sea surface reconstruction. Journal of Computational Geometry 14(2), 2023 (preliminary version at SoCG 2022). doi
Faster Fréchet distance for time series (SoCG 2026 Best Student Paper)
The Fréchet distance compares curves while respecting the order along them. For general curves,
quadratic running time is believed to be necessary. For time series of very different lengths (the
“imbalanced” case), we built a query data structure that beats this barrier, and extended the approach
to the Fréchet distance under translation and scaling. Finally, Lotte Blank closed the gap between upper
and lower bounds in a single-author paper that received the Best Student Paper Award at SoCG 2026.
Project: B1
- L. Blank. Fréchet distance in the imbalanced case. SoCG 2026. doi
- L. Blank, J. Conradi, A. Driemel, B. Kolbe, A. Nusser, M. Richter. Transforming dogs on the line: On the Fréchet distance under translation or scaling in 1D. SoCG 2025. doi
- L. Blank, A. Driemel. A faster algorithm for the Fréchet distance in 1D for the imbalanced case. ESA 2024. doi
Matching building polygons across datasets
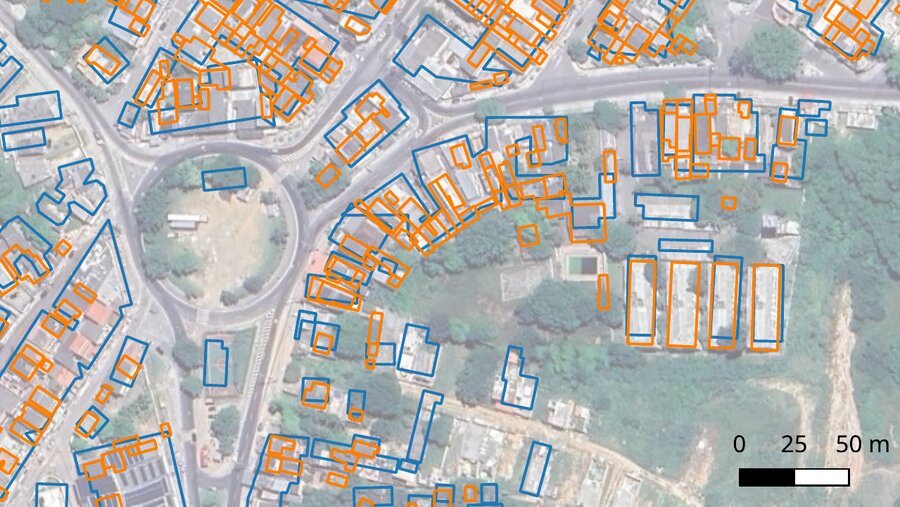 The same buildings appear differently in different datasets: one building in OpenStreetMap may correspond
to two in another source, and vice versa. We match groups of polygons rather than single buildings,
using an objective based on the Jaccard index. The approach scales to large urban datasets and has been
transferred to comparing agricultural land-use maps. Such matchings are essential for data integration
and quality assessment.
Figure: Building footprints from two sources and the many-to-many correspondences found by our method.
The same buildings appear differently in different datasets: one building in OpenStreetMap may correspond
to two in another source, and vice versa. We match groups of polygons rather than single buildings,
using an objective based on the Jaccard index. The approach scales to large urban datasets and has been
transferred to comparing agricultural land-use maps. Such matchings are essential for data integration
and quality assessment.
Figure: Building footprints from two sources and the many-to-many correspondences found by our method.
Project: C1
- A. Naumann, A. Bonerath, J.-H. Haunert. Many-to-many polygon matching à la Jaccard. ESA 2024. doi
- A. Naumann, A. Bonerath, J.-H. Haunert. Scalable many-to-many building footprint matching. Information Fusion 124, 2025. doi
- A. Naumann, S. Gedicke, J.-H. Haunert. A scalable matching approach for the comparison of agricultural land use maps based on corresponding field polygons. International Journal of Digital Earth 19(1), 2026. doi
All publications
Publications of the research unit, newest first. Project codes are given in brackets.
2026
- F. Heeg, J. Sauer, P. Mutzel, I. Scholtes. Weisfeiler and Leman follow the arrow of time: Expressive power of message passing in temporal event graphs. NeurIPS 2026, to appear. arXiv (B2)
- L. Bülte, A. Naumann, J. Schlurmann, J.-H. Haunert, P. Mutzel. geomGMD: Translation- and rotation-invariant geometric graph mapping distance for building footprint similarity. ACM SIGSPATIAL 2026, to appear. (B2, C1)
- P. Mayer, A. Naumann, F. Roth, A. Bonerath, J. Sauer, P. Mutzel, J.-H. Haunert. Temporally consistent aggregation of building footprints [Experiment]. ACM SIGSPATIAL 2026, to appear. (B2, C1)
- L. Blank, D. Eppstein, J.-H. Haunert, H. J. Haverkort, B. Kolbe, P. Mayer, P. Mutzel, A. Naumann, J. Sauer. Bicriteria polygon aggregation with arbitrary shapes. ESA 2026, LIPIcs 388:11. doi (B1, B2, C1)
- D. Faber, J.-H. Haunert, P. Mutzel. Strong ILP formulations for the p-regions problem. ESA 2026, LIPIcs 388:13. doi (B2, C1)
- M. Kaibel, P. Mutzel. Optimality-preserving data reduction for maximum k-cut. ESA 2026, LIPIcs 388:21. doi (B2)
- T. Brand, D. Faber, S. Held, P. Mutzel. A customized SAT-based solver for graph coloring. ALENEX 2026, pp. 142–155. doi (B2)
- A. Driemel, J. Höckendorff, I. Psarros, C. Sohler. Time series decomposition using the Fréchet distance. ESA 2026, LIPIcs 388:96. doi (A3, B1)
- J. Eube, H. Röglin. New algorithms and hardness results for connected clustering. ESA 2026, LIPIcs 388:135. doi (A1)
- P. Peng, C. Sohler, Y. Xu. Sublinear algorithms for estimating single-linkage clustering costs. ESA 2026, LIPIcs 388:86. doi (A3)
- M. Ebbens, J. Lu, A. Munteanu. Dimension reduction for curves: Simplified and generalized. ESA 2026, LIPIcs 388:116. doi (A3)
- A. Driemel, J. Höckendorff, I. Psarros, C. Sohler, D. Yue. Near linear time approximation schemes for clustering of partially doubling metrics. ICALP 2026, LIPIcs 374:80. doi (A3, B1)
- L. Blank, S. Cabello, M. T. Hajiaghayi, R. Krauthgamer, S. Mahabadi, A. Nusser, J. M. Phillips, J. Sauer. The expiration streaming model: Diameter, k-center, counting, sampling, and friends. ICALP 2026, LIPIcs 374:37. doi (B1, B2)
- L. Blank, K. Bringmann, P. Chalermsook, Karthik C. S., B. Kolbe, H. Le, G. van Wordragen. Fine-grained complexity of continuous Euclidean k-center. STOC 2026, pp. 330–341. doi (B1)
- N. Funk, A. Hennes, J. Hillebrand, S. Sturm. Constant-factor approximations for doubly constrained fair k-center, k-median and k-means. SWAT 2026, LIPIcs 370:19. doi (A1, A2)
- M. Ebbens, Y. Yoshida. Average sensitivity of geometric algorithms. ITCS 2026, LIPIcs 362:53. doi (A3)
- L. Blank. Fréchet distance in the imbalanced case. SoCG 2026, LIPIcs 17. Best Student Paper Award. doi (B1)
- J. Conradi, B. Kolbe, P. Mayer, J. Sauer, J. Spalding-Jamieson. Engineering greedy heuristics and simulated annealing methods for the median triangulation under the parallel flip distance (CG Challenge). SoCG 2026 (CG:SHOP 2026, 4th place), LIPIcs 367:106. doi (B1, B2)
- J.-H. Haunert, A. Driemel, P. Mutzel. Geoinformation perspectives on recent developments in algorithm engineering and computational geometry. PFG – J. Photogrammetry, Remote Sensing and Geoinformation Science, 2026. doi (B1, B2, C1)
- A. Naumann, S. Bergé, J. Sauer, J.-H. Haunert. Building footprint aggregation with preservation of edge orientations. ISPRS Annals XI-4-2026:153–161. doi (B2, C1)
- A. Naumann, S. Gedicke, J.-H. Haunert. A scalable matching approach for the comparison of agricultural land use maps based on corresponding field polygons. International Journal of Digital Earth 19(1), 2026. doi (C1)
- B. Uebbing, K. Vielberg, R. Rietbroek, B. Aschenneller, A. Köhl, J. Kusche. Improving global and regional ocean heat content by consistently combining GRACE gravity, satellite altimetry and Argo profile observations in a joint inversion framework. Earth System Science Data 18(9):6945–6972, 2026. doi (C2)
- M. O. Willen, B. Uebbing, M. Horwath, J. Kusche. Improving the representation of the ice-sheet contribution to sea level within a global inversion framework. Geophysical Journal International, 2026. doi (C2)
- J. Hillebrand, J. Höckendorff, J. Kusche, K. Luo, H. Röglin, M. Schmidt, C. Sohler, B. Uebbing. Connected subspace clustering: Hardness, a scalable heuristic, and an application to sea level geodesy. arXiv:2608.14215. arXiv (A1, A2, A3, C2)
- J.-H. Haunert, J. M. Könen, H. Röglin, T. Stuck. Finding regions of maximum circularity in plane geometric graphs. arXiv:2607.28298. arXiv (A1, C1)
- L. Bülte, P. Mayer, L. Müller, P. Mutzel. A separator-based algorithm for the graph edit distance problem. arXiv:2608.04583. arXiv (B2)
- A. D'Ascenzo, J. Meffert, P. Mutzel, F. Rossi. ExactGED: ILP benchmarking and optimal GED dataset. ECML/PKDD 2026 Workshops, LNCS, to appear. (B2)
- L. Blank, A. Driemel, S. Har-Peled, M. Richter. The quick dog jumps the log. arXiv:2607.09917. arXiv (B1)
- F. Brüning, S.-W. Cheng, A. Driemel, H. Huang. Solving proximity problems for polygonal shapes via polynomials. arXiv:2308.05998v3, 2026. arXiv (B1)
- J. Höckendorff, F. Hommelsheim, C. Sohler, D. Yue. A fast and simple (1+ε)-approximation for minimum spanning trees in doubling metrics. arXiv:2607.13284. arXiv (A3)
2025
- P. Rottmann, A. Driemel, H. J. Haverkort, H. Röglin, J.-H. Haunert. Bicriteria shapes: Hierarchical grouping and aggregation of polygons with an efficient graph-cut approach. ACM TSAS 11(1):3, 2025. doi (A1, B1, C1)
- A. Bonerath, A. Driemel, J.-H. Haunert, H. J. Haverkort, E. Langetepe, B. Niedermann. Algorithms for consistent dynamic labeling of maps with a time-slider interface. IEEE TVCG 31(10):6691–6704, 2025. doi (A1, B1, B2, C1)
- A. Beines, M. Kaibel, P. Mayer, P. Mutzel, J. Sauer. A simpler approach for monotone parametric minimum cut: Finding the breakpoints in order. ALENEX 2025, pp. 29–41. doi (B2)
- A. D'Ascenzo, J. Meffert, P. Mutzel, F. Rossi. Enhancing graph edit distance computation: Stronger and orientation-based ILP formulations. Proc. VLDB Endow. 18(11):4737–4749, 2025. doi (B2)
- A. D'Ascenzo, J. Meffert, P. Mutzel, F. Rossi. Accelerating graph similarity search through integer linear programming. arXiv:2511.02611, 2025. arXiv (B2)
- J. Könen, H. Röglin, T. Stuck. Parameterized algorithms for computing Pareto sets. ESA 2025, LIPIcs 351:105. doi (A1)
- J. Eube, K. Luo, D. Reineccius, H. Röglin, M. Schmidt. Connected k-median with disjoint and non-disjoint clusters. ESA 2025, LIPIcs 63. doi (A1, A2)
- M. Kaul, K. Luo, M. Mnich, H. Röglin. Approximate minimum tree cover in all symmetric monotone norms simultaneously. STACS 2025, LIPIcs 57. doi (A1)
- A. Arutyunova, H. Röglin. The price of hierarchical clustering. Algorithmica 87(10):1420–1452, 2025. doi (A1)
- M. Ebbens, N. Funk, J. Höckendorff, C. Sohler, V. Weil. A subquadratic time approximation algorithm for individually fair k-center. AISTATS 2025, PMLR 258:2287–2295. pdf (A3)
- P. Afshani, M. Buchin, A. Driemel, M. Richter, S. Wong. Property testing of curve similarity. ESA 2025, LIPIcs 84. doi (B1)
- J. Conradi, A. Driemel. Subtrajectory clustering and coverage maximization in cubic time, or better. ESA 2025, LIPIcs 12. doi (B1)
- L. Blank, J. Conradi, A. Driemel, B. Kolbe, A. Nusser, M. Richter. Transforming dogs on the line: On the Fréchet distance under translation or scaling in 1D. SoCG 2025, LIPIcs 22. doi (B1)
- A. Driemel, M. Monemizadeh, E. Oh, F. Staals, D. P. Woodruff. Range counting oracles for geometric problems. SoCG 2025, LIPIcs 42. doi (B1)
- F. Brüning, A. Driemel, A. Ergür, H. Röglin. On the number of iterations of the DBA algorithm. Data Mining and Knowledge Discovery 39(5):52, 2025 (preliminary version at SDM 2024). doi (A1, B1)
- A. Naumann, A. Bonerath, J.-H. Haunert. Scalable many-to-many building footprint matching. Information Fusion 124:103360, 2025. doi (C1)
- L. Rosenberger, Y. Shen, J.-H. Haunert. Simultaneous selection and displacement of buildings and roads for map generalization via mixed-integer quadratic programming. International Journal of Geographical Information Science 39(7):1567–1596, 2025. doi (C1)
2024
- A. Arutyunova, J. Eube, H. Röglin, M. Schmidt, S. Sturm, J. Wargalla. Approximately Pareto-optimal solutions for bi-objective k-clustering. NeurIPS 2024. doi (A1, A2)
- L. Drexler, J. Eube, K. Luo, D. Reineccius, H. Röglin, M. Schmidt, J. Wargalla. Connected k-center and k-diameter clustering. Algorithmica 86(11):3425–3464, 2024. doi (A1, A2)
- L. Blank, A. Driemel. A faster algorithm for the Fréchet distance in 1D for the imbalanced case. ESA 2024, LIPIcs 28. doi (B1)
- L. Blank, A. Driemel. Range reporting for time series via rectangle stabbing. SWAT 2024, LIPIcs 15. doi (B1)
- A. Naumann, A. Bonerath, J.-H. Haunert. Many-to-many polygon matching à la Jaccard. ESA 2024, LIPIcs 90. doi (C1)
- P. Mayer, P. Mutzel. Engineering A* search for the flip distance of plane triangulations. SEA 2024, LIPIcs 301:23 (best paper finalist). doi (B2)
- J. Charfreitag, C. Dahn, M. Kaibel, P. Mayer, P. Mutzel, L. Schürmann. Separator based data reduction for the maximum cut problem. SEA 2024, LIPIcs 301:4. doi (B2)
- D. Faber, A. Jabrayilov, P. Mutzel. SAT encoding of partial ordering models for graph coloring problems. SAT 2024, LIPIcs 305:12. doi (B2)
- A. Dobler, M. Jünger, P. J. Jünger, J. Meffert, P. Mutzel, M. Nöllenburg. Revisiting ILP models for exact crossing minimization in storyline drawings. GD 2024, LIPIcs 31. doi (B2)
- F. Brüning, A. Driemel, A. Ergür, H. Röglin. On the number of iterations of the DBA algorithm. SIAM SDM 2024, pp. 172–180. (A1, B1)
- B. Uebbing, J. Höckendorff, C. Jungheim, A. Driemel, C. Sohler, J. Kusche. An alternative to PCA utilizing dynamic time warping. EGU General Assembly 2024, EGU24-8993. doi (A3, B1, C2)
- M. O. Willen, M. Horwath, E. Buchta, M. Scheinert, V. Helm, B. Uebbing, J. Kusche. Globally consistent estimates of high-resolution Antarctic ice mass balance and spatially resolved glacial isostatic adjustment. The Cryosphere 18(2):775–790, 2024. doi (C2)
2023
- A. Arutyunova, A. Driemel, J.-H. Haunert, H. J. Haverkort, J. Kusche, E. Langetepe, P. Mayer, P. Mutzel, H. Röglin. Minimum-error triangulations for sea surface reconstruction. Journal of Computational Geometry 14(2):108–171, 2023 (preliminary version at SoCG 2022). doi (A1, B1, B2, C1, C2)
- S. Duong, P. Rottmann, J.-H. Haunert, P. Mutzel. Clustering building footprint polygons based on graph similarity measures. 1st ACM SIGSPATIAL International Workshop on Advances in Urban-AI, pp. 22–31, 2023. doi (B2, C1)
- L. Drexler, J. Eube, K. Luo, H. Röglin, M. Schmidt, J. Wargalla. Connected k-center and k-diameter clustering. ICALP 2023, LIPIcs 50. (A1, A2)
- L. Oettershagen, N. M. Kriege, P. Mutzel. A higher-order temporal H-index for evolving networks. KDD 2023, pp. 1770–1782. doi (B2)
- L. Oettershagen, N. M. Kriege, C. Jordan, P. Mutzel. A temporal graphlet kernel for classifying dissemination in evolving networks. SIAM SDM 2023, pp. 19–27. doi (B2)
- L. Oettershagen, P. Mutzel. An index for temporal closeness computation in evolving graphs. SIAM SDM 2023, pp. 280–288. doi (B2)
- J. Charfreitag, S. Mallach, P. Mutzel. Integer programming for the maximum cut problem: A refined model and implications for branching. SIAM ACDA 2023, pp. 63–74. doi (B2)
- J. Conradi, A. Driemel. Finding complex patterns in trajectory data via geometric set cover. arXiv:2308.14865. arXiv (B1)
2022
- M. O. Willen, M. Horwath, A. Groh, V. Helm, B. Uebbing, J. Kusche. Feasibility of a global inversion for spatially resolved glacial isostatic adjustment and ice sheet mass changes proven in simulation experiments. Journal of Geodesy 96:75, 2022. doi (C2)
Data and software
We publish data and code together with our papers. The
AlgoForGe data portal
gives an overview of all datasets published by the research unit across repositories.
- B. Uebbing, J. Kusche. Gridded (0.25 deg) monthly ocean heat content from consistently combining GRACE(-FO) satellite gravimetry, in situ Argo profiles and satellite altimetry. PANGAEA, 2026. doi
- J.-H. Haunert, P. Mayer, P. Mutzel, A. Naumann, P. Rottmann, J. Sauer. Polygon aggregation max-flow instances for the 13th DIMACS Implementation Challenge. Zenodo, 2026. doi
- D. Faber. p-regions: result data (ESA 2026). Zenodo, 2026. doi
- M. Kaibel, P. Mutzel. Source code: Optimality-preserving data reduction for maximum k-cut. Zenodo, 2026. doi
- P. Rottmann, J.-H. Haunert, P. Mayer, P. Mutzel, J. Sauer. Polygon aggregation instances for monotone parametric minimum cut. Zenodo, 2024. doi
- A. Beines, M. Kaibel, P. Mayer, P. Mutzel, J. Sauer. A simpler approach for monotone parametric minimum cut (code). Zenodo, 2024. doi
- T. Brand, D. Faber, S. Held, P. Mutzel. A customized SAT-based solver for graph coloring (code, version 2). Zenodo, 2025. doi